
Analytik,
Nahtlos Eingebettet
icCube ist eine eingebettete Analyseplattform, die so konzipiert ist, dass sie in Ihrer B2B-SaaS-Anwendung verschwindet.
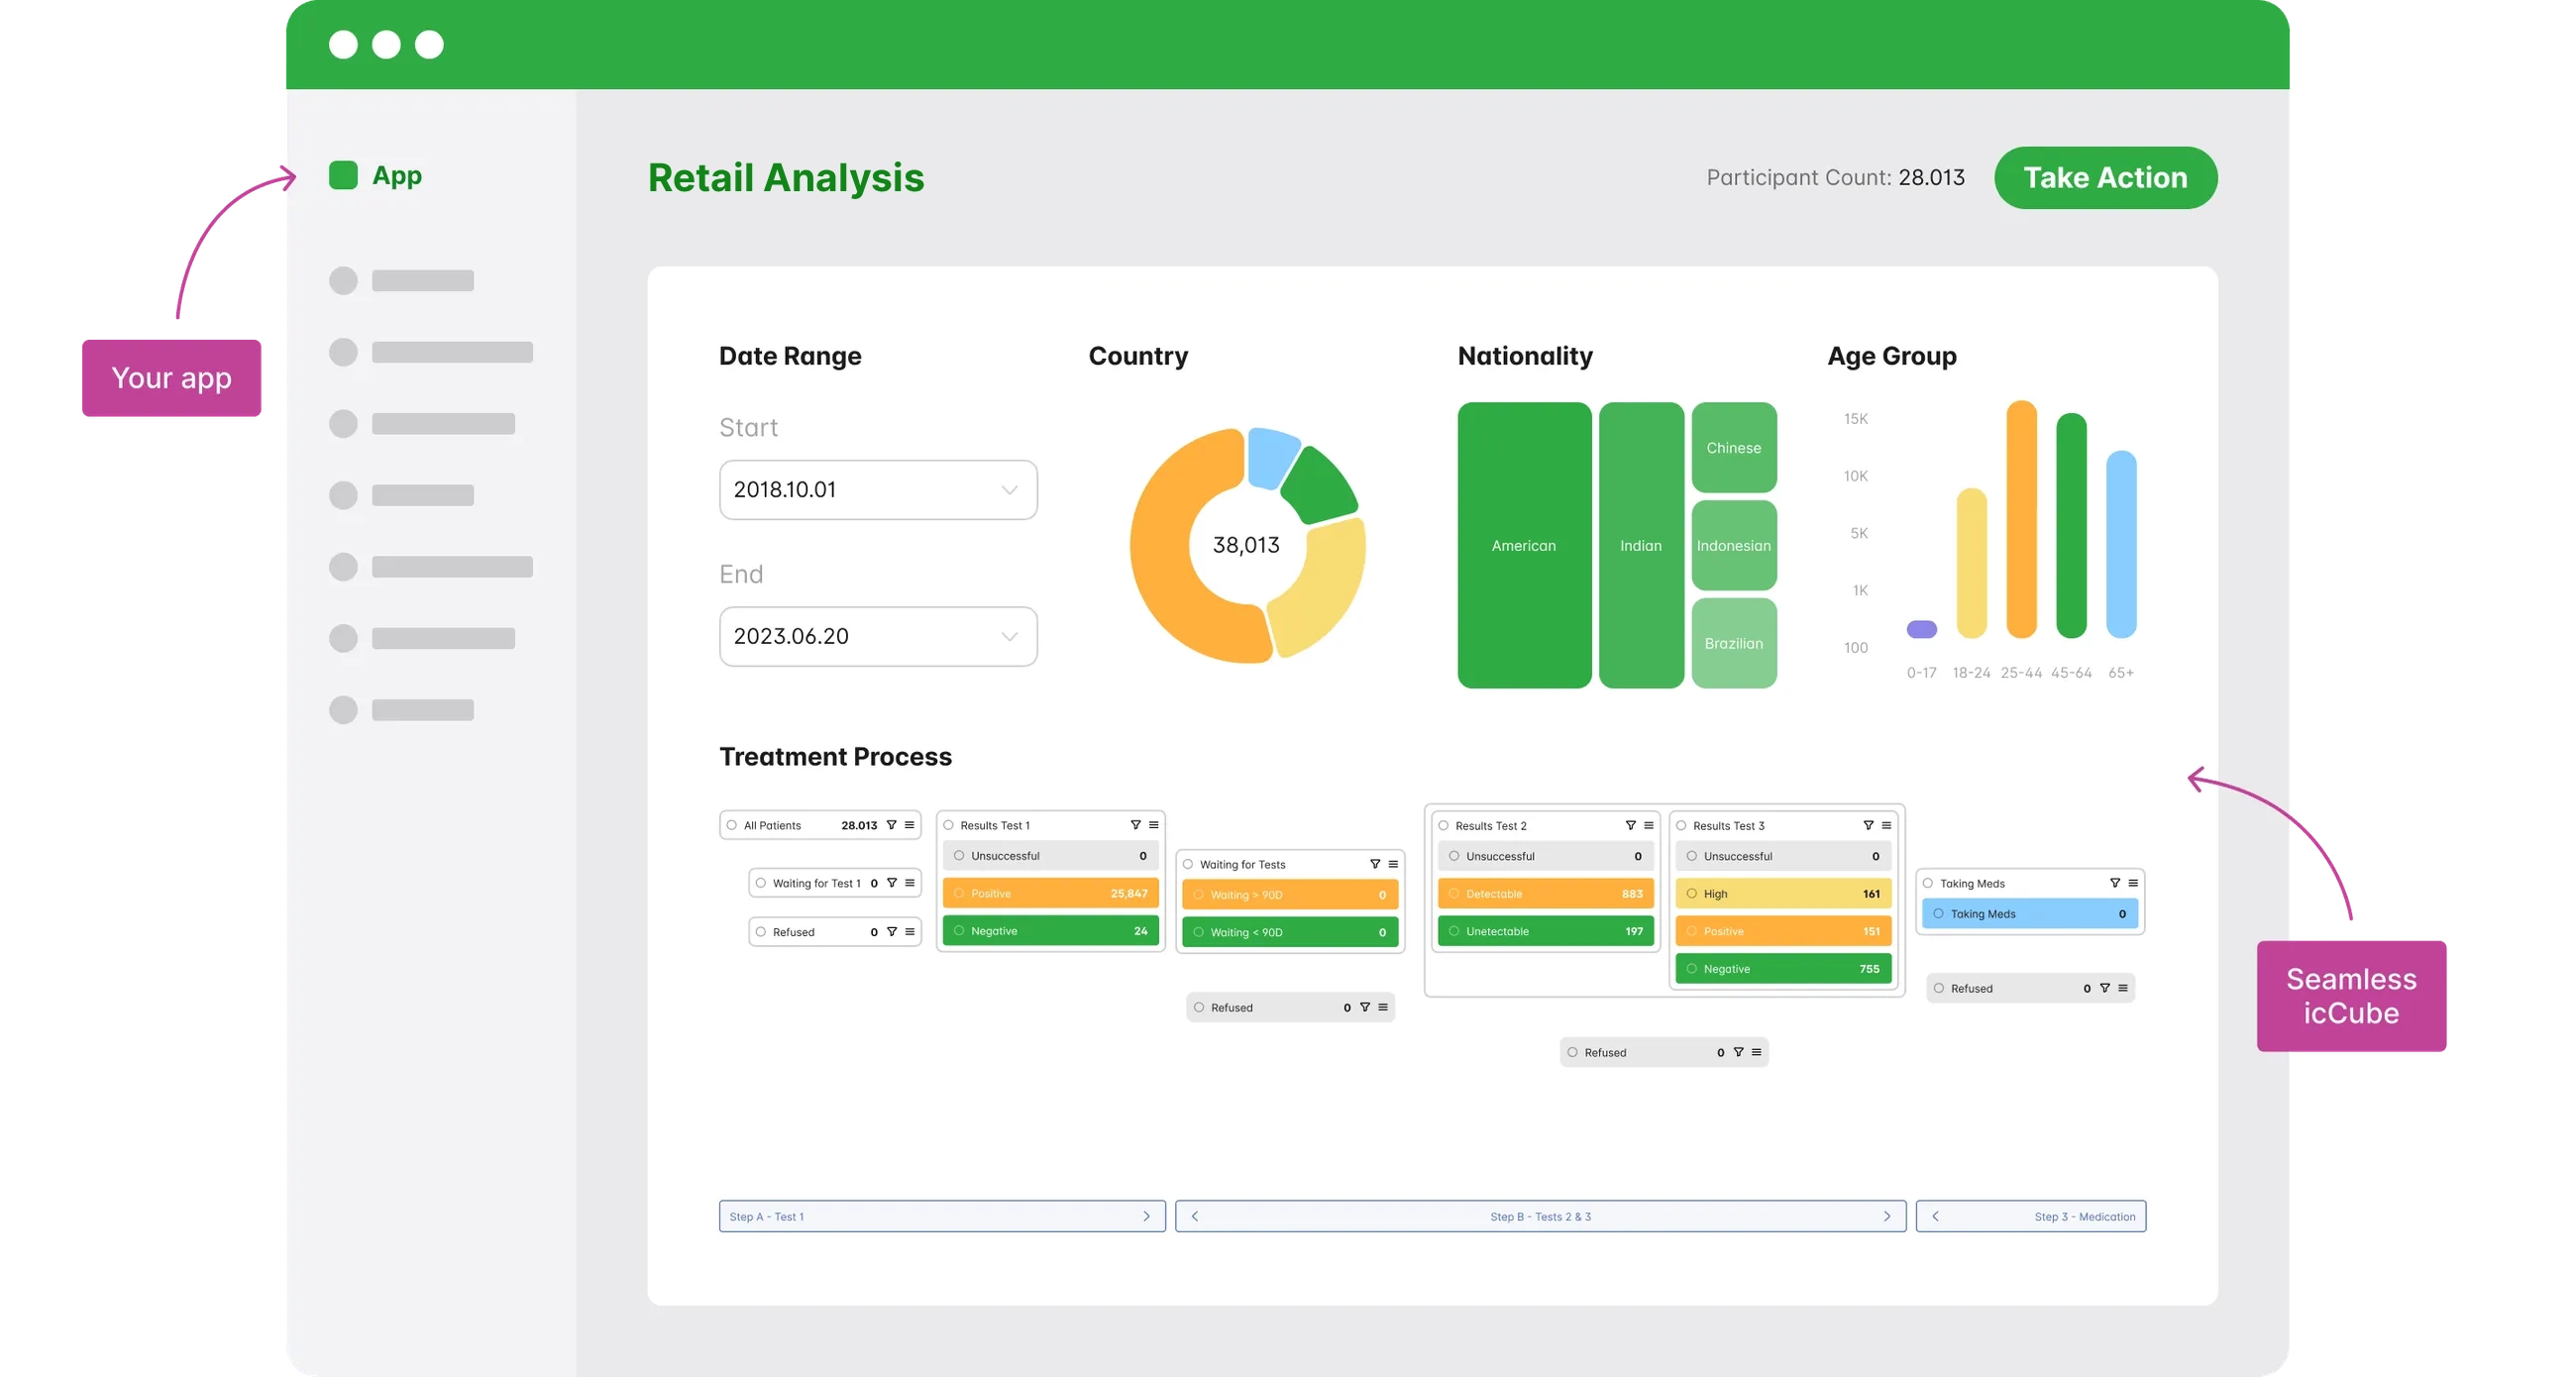
POS Analyse-Dashboard
icCube liefert anpassbare Dashboards, die sich an Ihre Bedürfnisse anpassen:
Verfolgen Sie den täglichen Umsatz, die Haupteinkaufszeiten, die Leistung Ihrer Mitarbeiter und die Rücklaufquoten, ohne sich von irrelevanten Daten überwältigen zu lassen.
Verschaffen Sie sich einen konsolidierten Überblick über mehrere Geschäfte, Regionen oder Produktkategorien, um Wachstumschancen und -risiken zu identifizieren.
Erfahren Sie, welche Werbeaktionen, Pakete oder Treueprogramme Stammkunden gewinnen.
Bestende Sicherheit Behalten
Mit der mehrinstanzenfähigen Analytics-Architektur von icCube können Sie:
- Verschaffen Sie sich einen Überblick über Ihr gesamtes Einzelhandelsnetzwerk aus der Vogelperspektive.
- Untersuchen Sie die Leistung einzelner Filialen, um sowohl Erfolge als auch Problembereiche zu erkennen.
- Vergleichen Sie standortübergreifende Kennzahlen, um Best Practices zu ermitteln.

Einsetzen
Irgendwo, Irgendwie
Irgendwo, Irgendwie
- Vertriebsteams können die meistverkauften Artikel, die Effektivität von Upsellings und die saisonalen Nachfragetrends überwachen.
- Bestandsmanager können den Warenumschlag verfolgen, Engpässe vorhersehen und die Verschwendung von Überbeständen reduzieren.
- Führungskräfte im Finanzbereich können Margen, Kostenstrukturen und Werbewirkung analysieren.
- Kundenservice-Teams können Muster bei Rücksendungen oder Rückerstattungen erkennen und so zur Verbesserung der Zufriedenheit beitragen.
Kunden Beeindrücken
Maßgeschneiderte Einblicke für Führungskräfte, Manager, Teams und Kunden.
Vergleichen Sie die Leistung standortübergreifend mit einer einheitlichen Ansicht.
Analysen zur Verbesserung des Kundenerlebnisses, der Kundenbindung und der Kundenbindung.
Erkennen Sie Trends, senken Sie Kosten und optimieren Sie die Personalausstattung.
Integrierte Echtzeitanalysen direkt in Ihrer Einzelhandelsplattform.
Ergreifen Sie auf der Grundlage der Analysen umgehend Maßnahmen, die über den bloßen Austausch numerischer Daten hinausgehen.
Kontaktieren Sie icCube für eine Personalisiertes Einzelhandels-Dashboard
Egal, ob Sie ein Geschäft oder eine nationale Kette verwalten, icCube gibt Ihnen das Vertrauen, sofort datengestützte Entscheidungen zu treffen. Kontaktieren Sie icCube noch heute und erfahren Sie, wie eingebettete Analysen Ihnen die Klarheit, Effizienz und Kundeninformationen bieten können, die Sie benötigen, um im Einzelhandel die Nase vorn zu haben.


Blog title heading will go here
Blog title heading will go here